SOC Automation Homelab
How are SOC analysts able to efficiently tackle security incidents across such large networks? The answer is automation!
In this lab, we create a Security Operations Center (SOC) environment that uses industry-standard free and open-source tools. We will deploy a Windows virtual machine and add functionality to forward important security events to Wazuh and create automatic responses through Shuffle. These responses will include gathering intelligence from sources online, documenting the event using a case management tool, and sending out emails containing details about the event to allow our analysts to remediate the issue.
By delving into these tools, we’ll learn their functionalities and how to utilize them to improve our incident response and threat detection capabilities.
Introduction
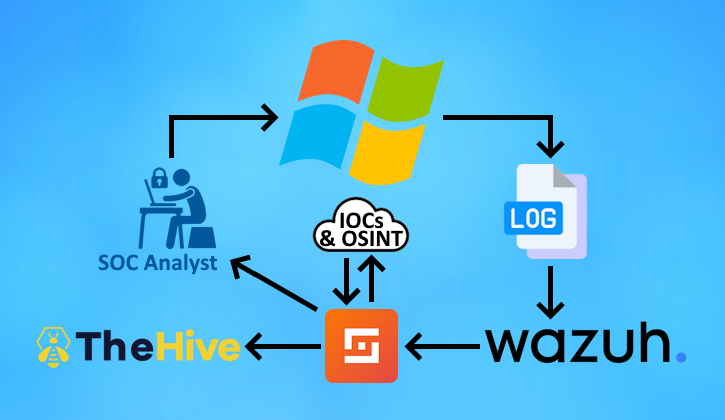
To recreate a Security Operations Center environment, let’s first look at the overall workflow we want to achieve:
The general workflow is that our Windows machine will forward important security events into the Wazuh Manager. We will install Sysmon and the Wazuh agent locally to this machine.
When Wazuh detects suspicious traffic, alerts are triggered and responsive actions occur. We will experiment with this by creating a custom rule that triggers when Mimikatz.exe is ran on our machine, by purposefully triggering it ourselves.
Shuffle is an automation tool that allows us to create a workflow that occurs when triggered. We will create create a webhook trigger event that will get activated by Wazuh when our custom rule occurs. This workflow will:
- Search the SHA-256 hash of the detected Mimikatz.exe using VirusTotal’s API
- Create an alert in TheHive case management tool
- Send an email containing the security event’s details to us to remediate
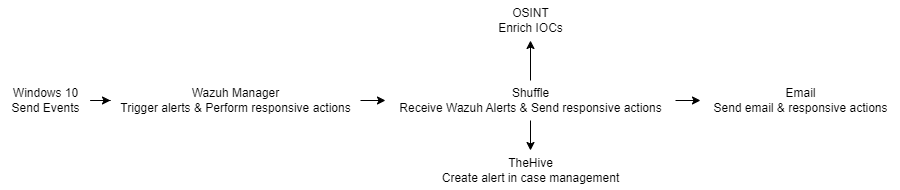
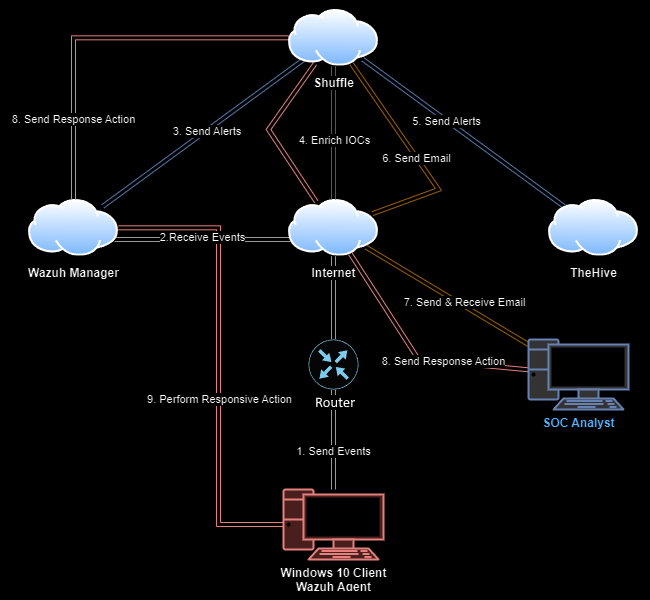 Diagram: Data flow through our Environment
Understanding the Concepts
Wazuh
Wazuh is a free and open-source security platform that functions as a SIEM (security information and event management) and XDR (extended detection and response) platform for endpoint devices.
Wazuh Agent
The Wazuh agent installed on our Windows 10 Client endpoint serves as our first line of defense by continuously monitoring the system for security events and log data. The agent encrypts and forwards this data securely to our central management server, the Wazuh Manager.
Wazuh Manager
Deployed in the cloud environment, the Wazuh Manager acts as a centralized hub for receiving, processing, and analyzing security events collected by the Wazuh agents. It analyzes the incoming data in realtime, using predefined rulesets and anomaly detection algorithms to identify potential security incidents. Upon detection, the Wazuh Manager triggers alerts and performs predefined responsive actions to mitigate threats promptly.
 Source: Wazuh Documentation
Shuffle
Shuffle serves as our Security Orchestration, Automation, and Response (SOAR) platform, and plays a crucial role in automating incident response processes. Upon receiving alerts from the Wazuh Manager, Shuffle orchestrates various tasks:
- Enrichment with OSINT: Shuffle uses open-source intelligence (OSINT) to enhance its understanding of detected indicators of compromise (IOCs).
- Case Management with TheHive: Shuffle integrates with TheHive to automatically create cases for each detected security incident. This allows for structured investigation, coordination, and documentation of response efforts.
- Alert Notifications via Email: Shuffle notifies the SOC Analysts about newly generated alerts. This ensures timely awareness and responsive actions.
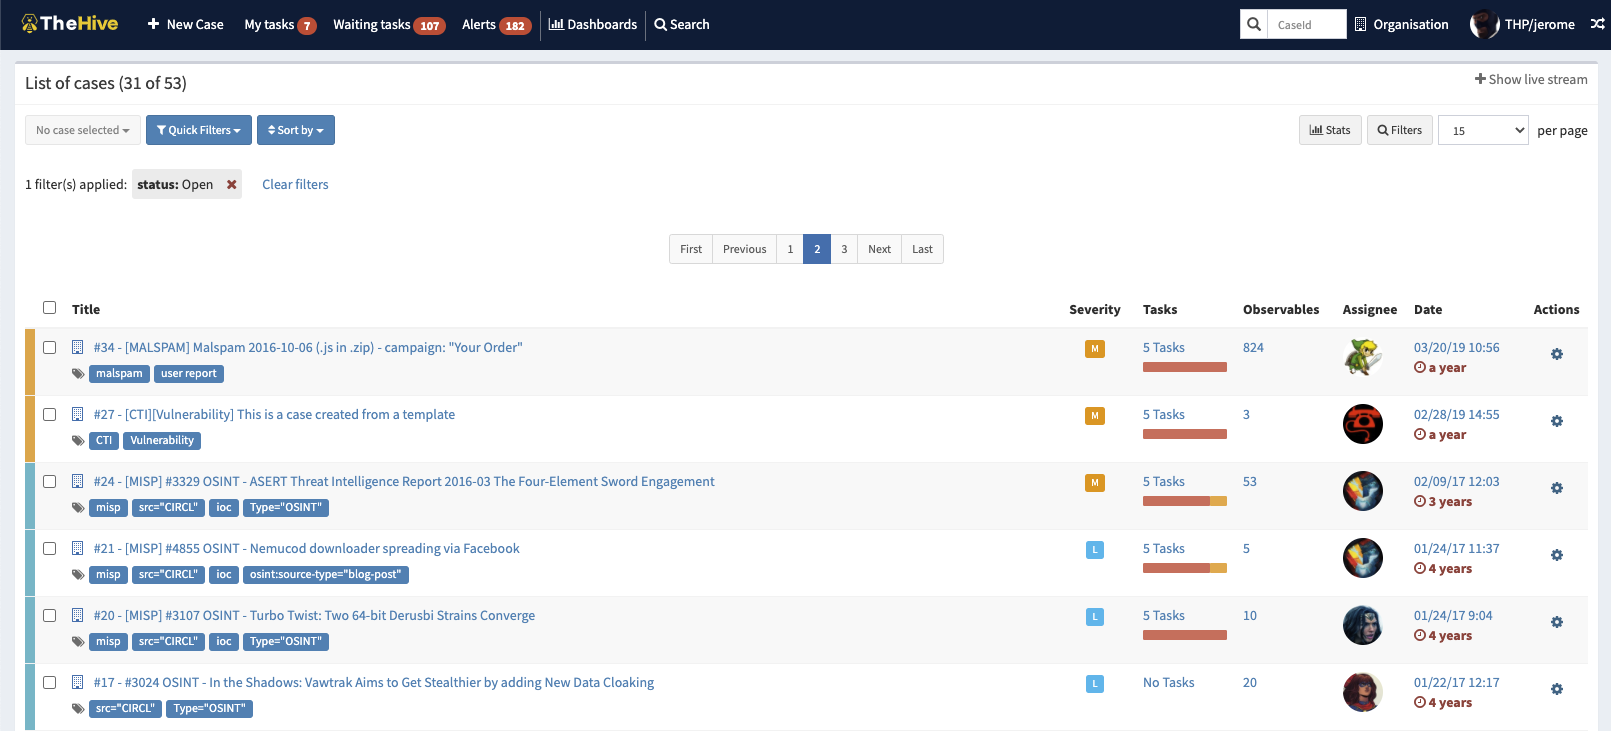
TheHive
Operating as a cloud-based incident response and case management tool, TheHive streamlines the management of security incidents. It provides a centralized platform for SOC teams to collaborate, analyze, and respond to threats effectively.
 Source: TheHive
Responsive Action
Upon receiving notification emails, SOC analysts interact with Shuffle to execute response actions. These actions encompass performing remediation steps, communicating with stakeholders, and these alerts as a feedback loop to use for continuously improving our environment.
Setting up the Environment
This lab makes use of three devices:
- Windows 10 client with Sysmon
- Wazuh Server (in the cloud)
- TheHive Server (in the cloud)
Windows 10 Client with Sysmon
Create the Windows 10 VM using a Windows 10 ISO.
- Download Sysmon
- Download sysmonconfig.xml from the sysmon-modular Github repository.
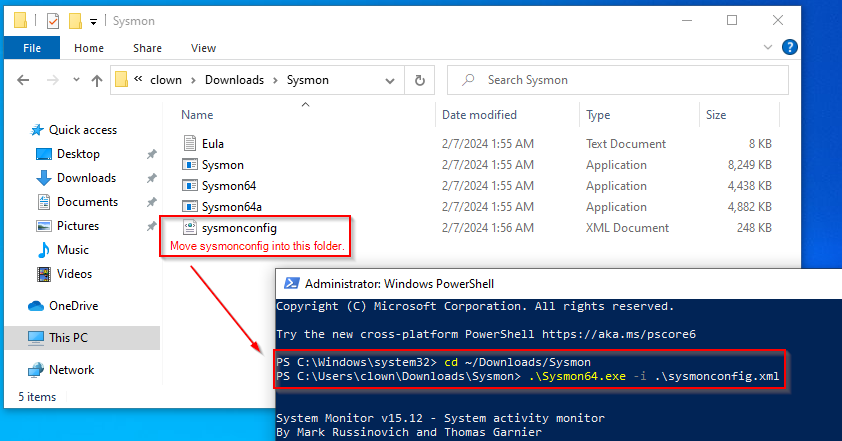
Setting up Sysmon:
- Extract Sysmon.zip and move sysmonconfig.xml into the folder.
- Run PowerShell as Administrator, navigate to the Sysmon folder, and use the command:
.\Sysmon64.exe -i .\sysmonconfig.xml
You can verify that Sysmon was installed successfully with:
- Services.msc: Confirm the presence of Sysmon64
- Event Manager: Application and Services Logs > Microsoft > Windows > Sysmon

Wazuh Server
You can choose to either set this up in the cloud (recommended), or in a virtual machine (manual, but you won’t need to sign up for an account).
If you want to set it up in a VM, you can use Ubuntu 22.04 and follow the Wazuh Quickstart Guide.
In the Cloud (Digital Ocean):
Create a new Droplet (cloud server)
- OS: Ubuntu 22.04 (LTS), Basic CPU, 8 GB RAM
- Set a password, and change your Hostname to ‘Wazuh’
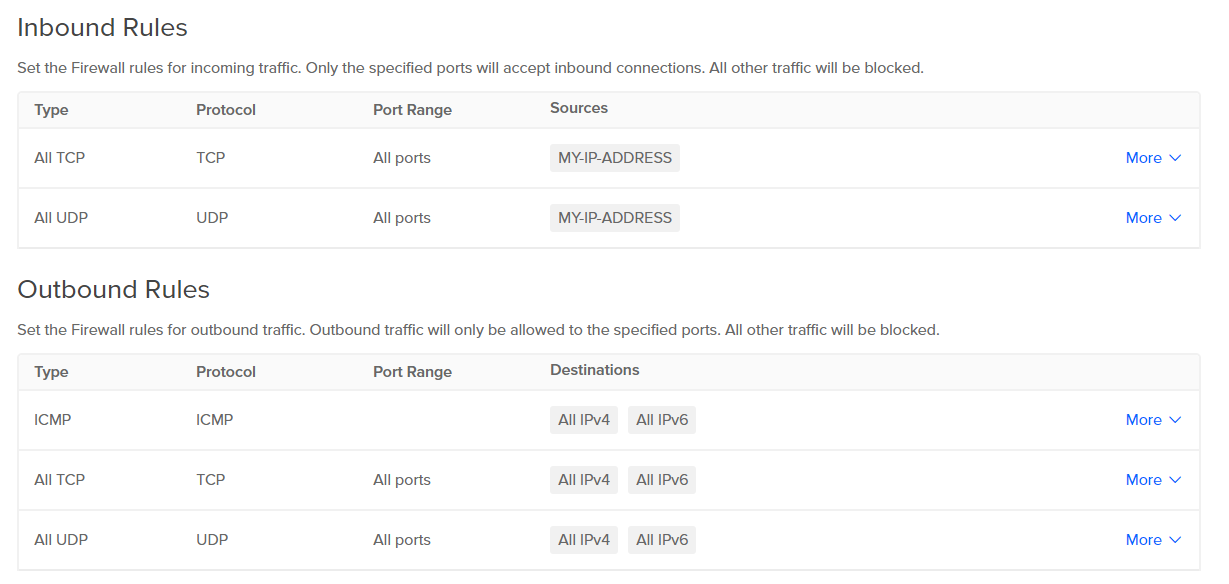
We will be accessing this VM using SSH over the internet, so let’s configure a firewall to mitigate potential security threats.
Create a Firewall:
- Navigate to: Networking > Firewalls
- Create Inbound rules to limit Incoming TCP and UDP traffic to your IP address.
Attach the Firewall:
- Navigate to Droplets > Wazuh > Networking > Firewalls, and click Edit.
- Select the Firewall we created: Droplets > Add Droplets > “Wazuh”.
SSH into the VM:
- Update packages:
apt-get update && apt-get upgrade -y
- Install Wazuh with the curl command located on the Wazuh Quickstart Guide.
curl -sO https://packages.wazuh.com/4.7/wazuh-install.sh && sudo bash ./wazuh-install.sh -a
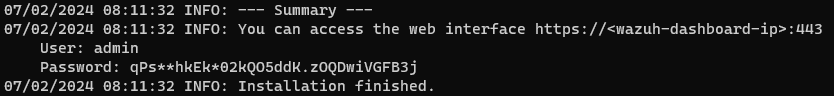
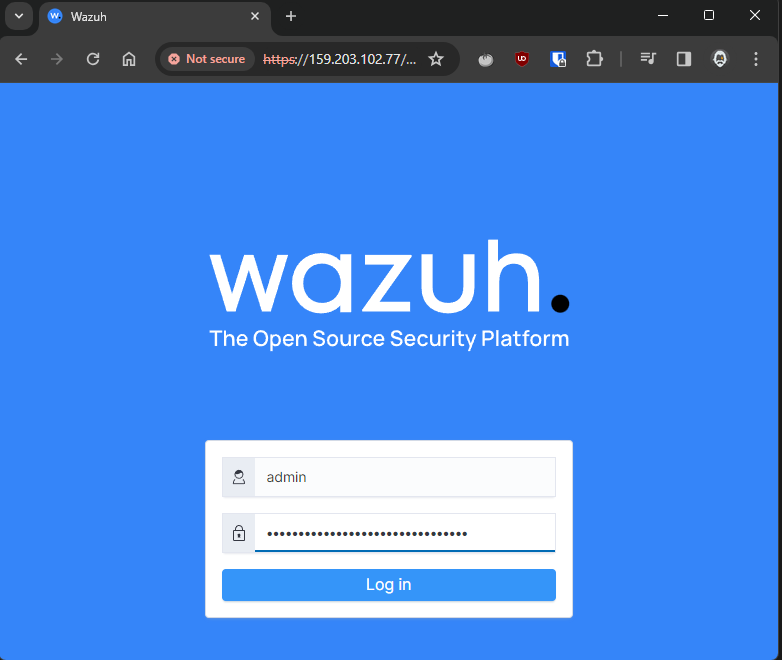
We can now access the Wazuh Dashboard at https://[Wazuh-Droplet-IP]/ and use the credentials to sign in.
TheHive Server
You can choose to either set this up in the cloud or on a virtual machine as well.
If you want to set up TheHive in a VM, use Ubuntu 22.04 and follow this guide to download TheHive & prerequisites.
In the Cloud (Digital Ocean):
Create a new Droplet (cloud server)
- OS: Ubuntu 22.04 (LTS), Basic CPU, 8 GB RAM
- Set a password, and change your Hostname to ‘TheHive’
Attach the Firewall:
- Navigate to Droplets > TheHive > Networking > Firewalls, and click Edit.
- Select the Firewall we created: Droplets > Add Droplets > “TheHive”.
SSH into the VM:
- Follow this guide for the commands to use to download TheHive and its prerequisites. (Java, Cassandra, ElasticSearch, TheHive)
Installing and Configuring Files
Configure TheHive Dependencies
Editing Cassandra config files:
- nano /etc/cassandra/cassandra.yaml
- Change
cluster_name(optional) - Change
listen_address:,rpc_address:, andseed_provider: seeds:to TheHive droplet’s public IP
- Change
- systemctl stop cassandra.service
- rm -rf /var/lib/cassandra/*
- systemctl start cassandra.service
Editing ElasticSearch config files:
- nano /etc/elasticsearch/elasticsearch.yml
- Uncomment and edit the following:
cluster.name: thehivenode.name: node-1- `network.host: [TheHive droplet’s public IP]
http.port: 9200- `cluster.initial_master_nodes: [“node-1”]
- Uncomment and edit the following:
- systemctl start elasticsearch
- systemctl enable elasticsearch
Limit ElasticSearch RAM usage (so it doesn't crash!):
- nano /etc/elasticsearch/jvm.options.d/jvm.options
- Paste the following:
-Dlog4j2.formatMsgNoLookups=true
-Xms2g
-Xmx2g
Configure TheHive
Set the owner of /opt/thp to thehive
- chown -R thehive:thehive /opt/thp
- Check using
ls -la /opt/thp
nano /etc/thehive/application.conf
- Set
hostname = ["TheHive droplet's public IP"]for all hostname variables. - Set
cluster-nameto the same ascluster_namein Cassandra earlier. - Change
application.baseURL = "http://[TheHive droplet's public IP]:9000"
Start TheHive:
- systemctl start thehive
- systemctl enable thehive
At this point, all 3 services should be running, which can be checked using systemctl status [service].
You can also now access the TheHive dashboard by navigating to [TheHive droplet's public IP]:9000 and signing in using the credentials: admin@thehive.local:secret
Add a Wazuh Agent
Within the Windows 10 VM, sign in to the Wazuh dashboard at https://<Wazuh-Droplet-IP>/
- If you forgot the credentials, you can go onto the Wazuh server, and do the following to unzip the wazuh-install-files.tar and view your passwords:
tar -xvf wazuh-install-files.tarcat wazuh-install-files/wazuh-passwords.txt
A message at the top of the page says “No agents were added to this manager. Add agent”, click on it to go to the page to deploy a new Wazuh agent.
Select the Windows Package, set the Server address to the Wazuh droplet IP address, set an agent name, and copy the given command into a PowerShell window with Administrator privileges.

After a little bit of time, refreshing the Wazuh dashboard will show that our agent was installed successfully!

Configure Wazuh to ingest Sysmon data
Wazuh acts a bit differently than other SIEMs - only logs that trigger a rule will appear on the Dashboard, rather than all logs being forwarded.
We will have to configure our Wazuh agent so that specific data, in our case Sysmon, will be ingested.
To set this up, follow these instructions.
Create Rules for Wazuh
On the Wazuh dashboard, under Management > Administration > Rules, we can create rules that will trigger when a specific event occurs.
Using a rule from 0800-sysmon_id_1.xml as a template:
- Select Custom rules > edit
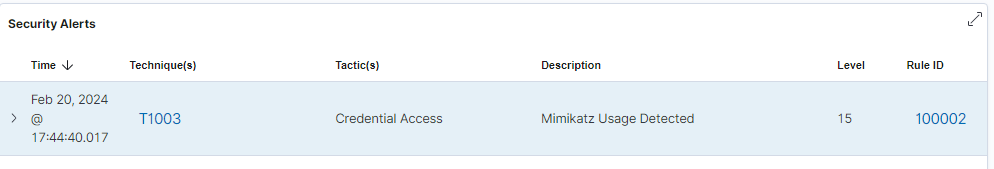
local_rules.xml - Add a new rule that will detect if an executed file’s original name was Mimikatz.exe:

Now, if we run Mimikatz on our system, a security alert will be created on our dashboard.
Automation through Shuffle
Create a Shuffle account at shuffler.io, go to the Workflows page, and create a new workflow called “SOC Automation Project”.
Select ‘Triggers’, and drag the ‘Webhook’ workflow starter into the project.
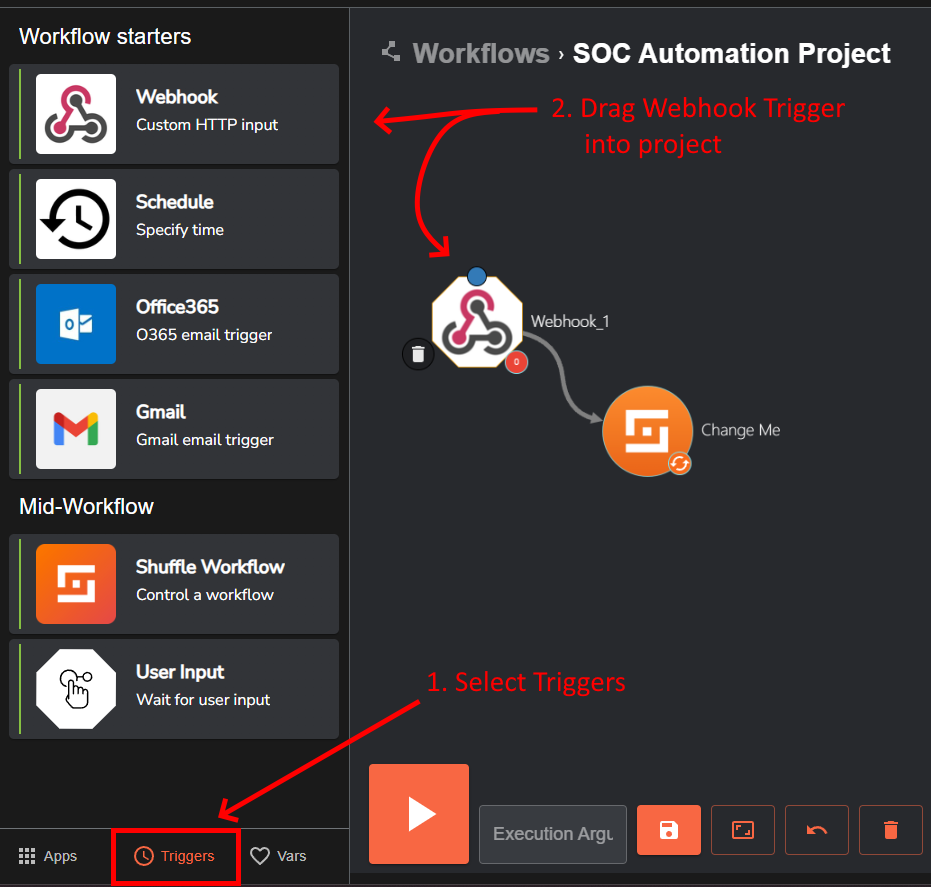
Give it a name such as ‘Wazuh-Alerts’ and copy the Webhook URI for later.
Select the 'Change Me' icon and set the following:
- Find Actions: Repeat back to me
- Call: $exec
We will need to SSH into the Wazuh droplet, and add our Webhook URI to Wazuh:
- nano /var/ossec/etc/ossec.conf
- Add the following to the ossec.conf file:

After the change we must restart the services: systemctl restart wazuh-manager.service
Back on Shuffle, select the Wazuh-Alerts Webhook, and press Start. Now running Mimikatz on our Windows VM should make a new webhook appear.

Creating a Workflow
Let's create an example workflow to show off the power of Shuffle:
- A Mimikatz alert is sent to Shuffle
- Shuffle receives the Mimikatz Alert and extracts the SHA256 Hash of the executed file.
- Check the file’s reputation score with VirusTotal
- Send details to TheHive to create an alert
- Send an email to the SOC Analyst to begin an investigation
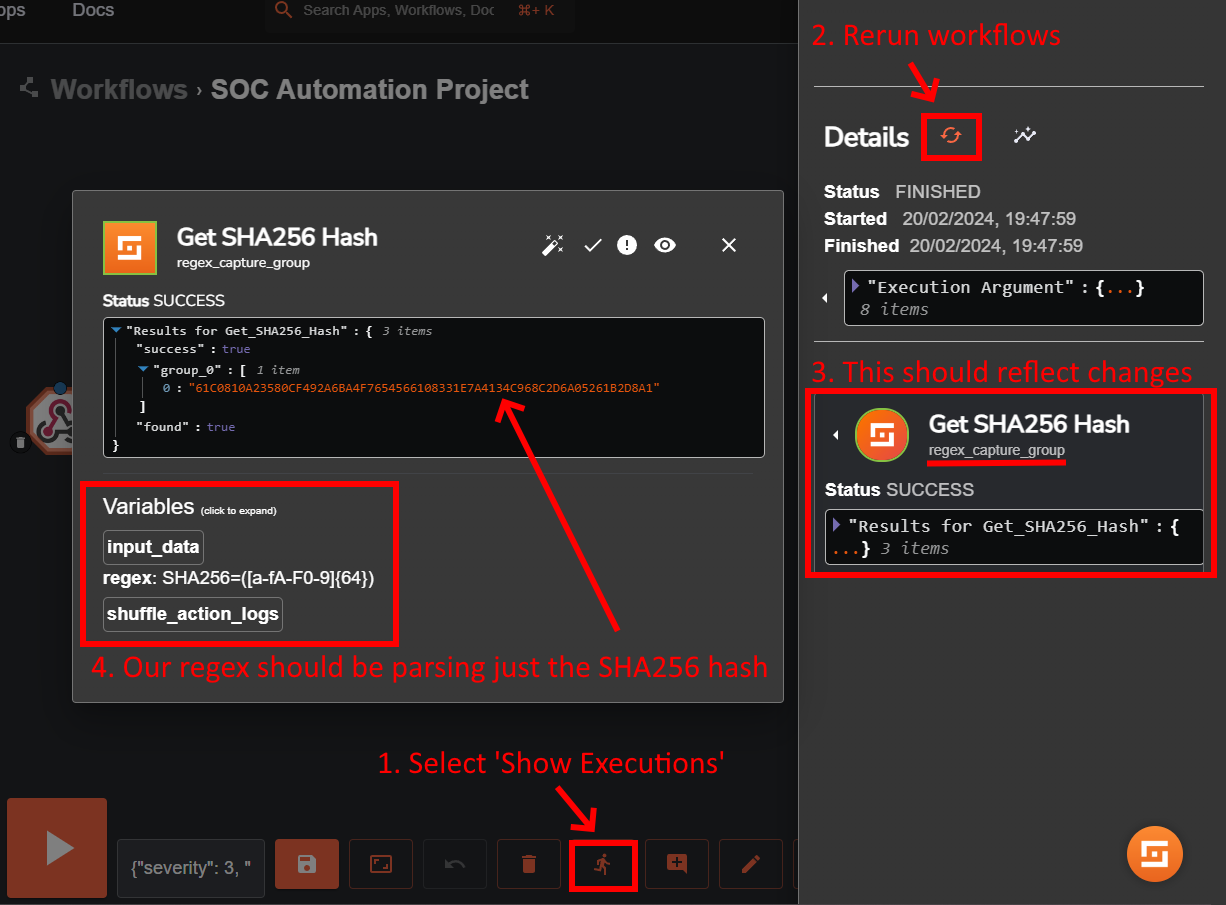
Shuffle is currently sending back the entire log through the webhook, we can have Shuffle parse out just the SHA256 hash within the log ("hashes": "SHA1=D34DB33F,MD5=ABCD,SHA256=12345...").
We can do this by editing the 'Change Me' object:
- Name:
Get_SHA256_Hash - Find Actions:
Regex capture group - Input data:
$exec.text.win.eventdata.hashes - Regex:
SHA256=([a-fA-F0-9]{64})
Save the workflow, then select ‘Show Executions’ at the bottom of the screen to rerun the workflow and view if our changes were successful.
Adding VirusTotal to Shuffle
To use VirusTotal’s API, register an account on VirusTotal, select the menu, and copy your API Key.
In Shuffle, add the Virustotal Active App to the project:

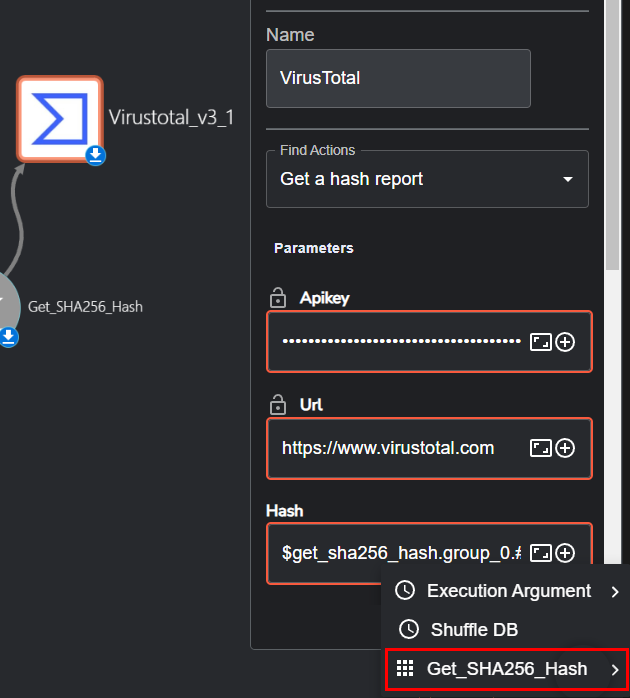
Configure the VirusTotal app in Shuffle with the following settings:
- Name:
VirusTotal - Find Actions:
Get a hash report - Parameters:
- Apikey:
[YOUR-API-KEY] - Url:
https://www.virustotal.com - Hash:
$get_sha256_hash.group_0.#
- Apikey:
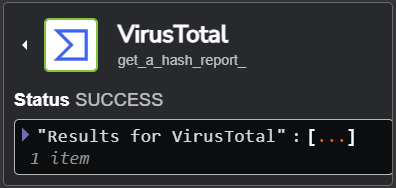
Save the changes, press ‘Show executions’, select the workflow runs, and press ‘Rerun workflows’. The reran workflow should say Status SUCCESS > “Results for Virustotal”.
Adding TheHive to Shuffle
In Shuffle, search and add TheHive to our project.

Log in to TheHive dashboard at http://[TheHive-Droplet-IP]:9000/
Create a new Organization for our project.

Click on the new organization that we created and create new users:
User 1:
- Type:
Normal - Login:
austin@test.com(use your name) - Name:
Austin - Profile:
analyst - Give this account a password: Select ‘Preview’ > ‘Set a new password’.
User 2:
- Type:
Service - Login:
shuffle@test.com - Name:
SOAR - Profile:
analyst
Generate an API key for this account: Select ‘Preview’ > API key.
Now go back onto Shuffle and select TheHive:
- Press the + button beside Authentication:
- Add the API key from our Service account, and the URL of our TheHive server. (
http://[TheHive-Droplet-IP]:9000/)
- Add the API key from our Service account, and the URL of our TheHive server. (
- Find Actions:
Create Alert
Now let’s give some details to this Alert. First, add a line connecting VirusTotal to TheHive in the workflow, allowing us to pass through details.
Click the checkmark next to Hide Body, and fill in the following information:
- Title:
$exec.title - Tags:
["T1003"] - Summary:
Mimikatz activity detection on host: $exec.text.win.system.computer and the process ID is: $exec.text.win.system.processID and the command line is: $exec.text.win.eventdata.commandLine - Severity:
2 - Type:
Internal - Tlp:
2 - Status:
New - Sourceref:
*Rule: 100002* - Source:
Wazuh - Pap:
2 - Flag:
false - Description:
Mimikatz Detected on host: $exec.text.win.system.computer from user: $exec.text.win.eventdata.user - Date:
$exec.text.win.eventdata.utcTime
In Digital Ocean, we need to allow all incoming traffic to Port 9000
In Digital Ocean > Networking > Firewalls > create a new Inbound Rule:
- Custom, TCP, 9000, All IPv4
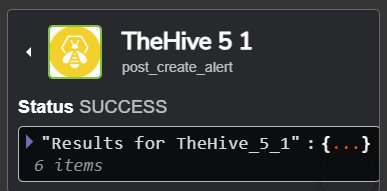
Now within Shuffle, select ‘Show Executions’, and rerun the workflow. There should be a new alert created in TheHive:

Adding Email to Shuffle
In Shuffle, search for and add the “Email” Active App. Add a line connecting VirusTotal to the Email in the workflow.
Setting up the email app is relatively straight-forward:
- Find Actions:
Send email shuffle - Recipients:
[Email-Address] - Subject:
[Alert] Mimikatz Detected! - Body:
Time: $exec.text.win.eventdata.utcTime
Title: $exec.title
Host: $exec.text.win.system.computer
PID: $exec.text.win.system.processID
Command Line: $exec.text.win.eventdata.commandLine
If you are running into errors, you can change the Find Action to Send email smtp and set up a temporary email address to use as the sender of these emails.

Conclusion
There are many powerful tools designed to aid in the detection and monitoring of a network. Security Information and Event Management Systems (SIEMs) provide the ability to ingest and normalize large quantities of data and many varieties of logs. Security orchestration, automation and response (SOAR) technologies help coordinate, execute and automate tasks and automation can make things a lot easier. It is always best practice to write documentation making case management tools indispensable.
Shoutout to MyDFIR on YouTube for the original guide to this lab!
I highly suggest his video series: Intro, Part 1, Part 2, Part 3, Part 4, Part 5, and I also highly suggest anyone interested in learning more check out the SOC Level 1 path on TryHackMe as well!
Gaining proficiency by getting hands-on experience with tools like SIEMs (Splunk, Wazuh), SOARs (Shuffle), and Case Management (TheHive) can only work to help you a become a effective security practitioner.